The blog:
Using Gantt Charts for Effective Project Scheduling
If you haven’t read it yet, we recommend starting with our article on the Work Breakdown Structure (WBS) to see how it helps in organizing tasks. This foundational step makes the next one—scheduling those tasks—much smoother. Here’s where the Gantt Chart comes in: it provides a timeline for each task, showing start and finish dates and how tasks connect to one another.
Article outline
A Gantt Chart is a visual tool that shows a project’s schedule. It lays out all the tasks from your WBS on a timeline, making it easy to see the project from start to finish. Each task is represented by a horizontal bar, with the length of the bar showing the task’s duration.
Components of a Gantt Chart
- Timeline: This shows the entire project duration, usually broken down by days, weeks, or months.
- Tasks: All tasks from the WBS are listed vertically on the side.
- Task Bars: Each task has a bar that stretches across the timeline, showing when it starts and finishes.
- Dependencies: Lines or arrows show how tasks depend on each other (e.g., Task B can only start once Task A is finished).
- Optional > Progress Indicators: Shaded portions of the bars show how much of the task has been completed.
Example of a Gantt Chart: Project Presentation
Let’s take the example of creating a Project Presentation to understand the Gantt Chart better.
- 1. Research: Week 1-3
- 2. Writing: Week 3-5
- 3. Editing: Week 5-8
- 4. Final Presentation: Week 8-9
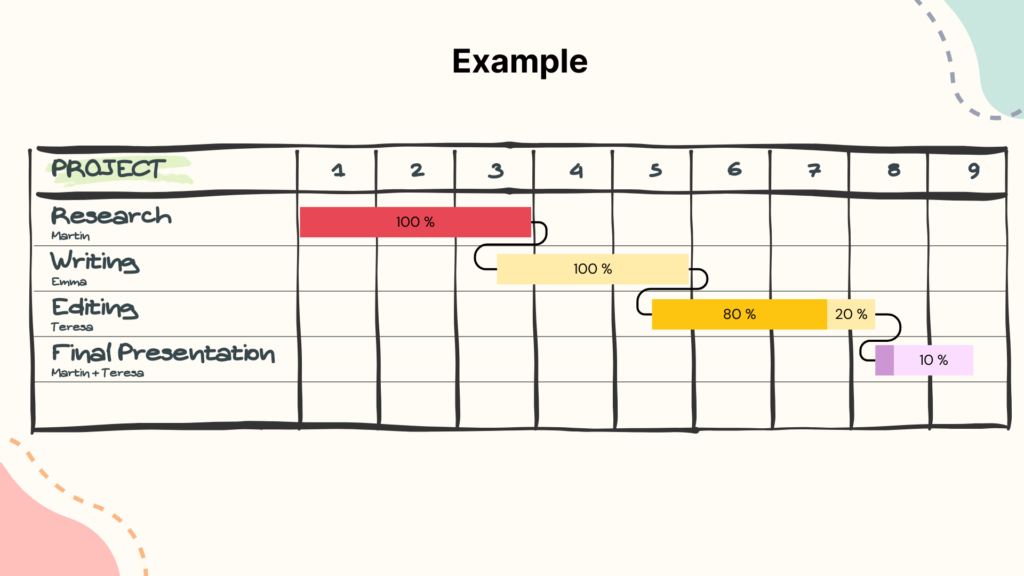
In this simplified example, the Gantt Chart helps you visualize how long each task will take and when it should be completed. Tasks like writing can only start after research is finished, which is shown by the arrows connecting tasks. You can also see that the project is currently in the Editing phase and the Final Presentation phase has been started.
How Gantt Charts Help Project Management
- Visualizing Deadlines: A Gantt Chart makes it easy to see when each task starts and ends, ensuring that nothing is missed.
- Managing Dependencies: It helps you manage task dependencies, making sure one task isn’t started before its predecessor is complete.
- Tracking Progress: You can see which tasks are on track and which might be falling behind, making it easier to adjust your schedule.
Combining WBS and Gantt Charts
The WBS helps you break the project into tasks, and the Gantt Chart helps you schedule those tasks. By combining both tools, you can ensure that your project is well-organized and completed on time.
Tools for Gantt Chart Creation
When creating a Gantt Chart, you have a range of tools, from simple to advanced. Google Sheets and Microsoft Excel are great for basic Gantt Charts; they offer templates and are easy to use. For more features, Trello (can be used for free to manage projects within a small team) and Asana (free for personal use) let you organize tasks with timelines, though they aren’t pure Gantt tools. If you need something more advanced, ClickUp (free for personal use), TeamGantt (free for one project), and Smartsheet (30-day free trial) provide dedicated Gantt Chart views, project tracking, and collaboration features. Microsoft Project is the go-to for complex project management, offering comprehensive Gantt functionality with task dependencies, timelines, and resource allocation.
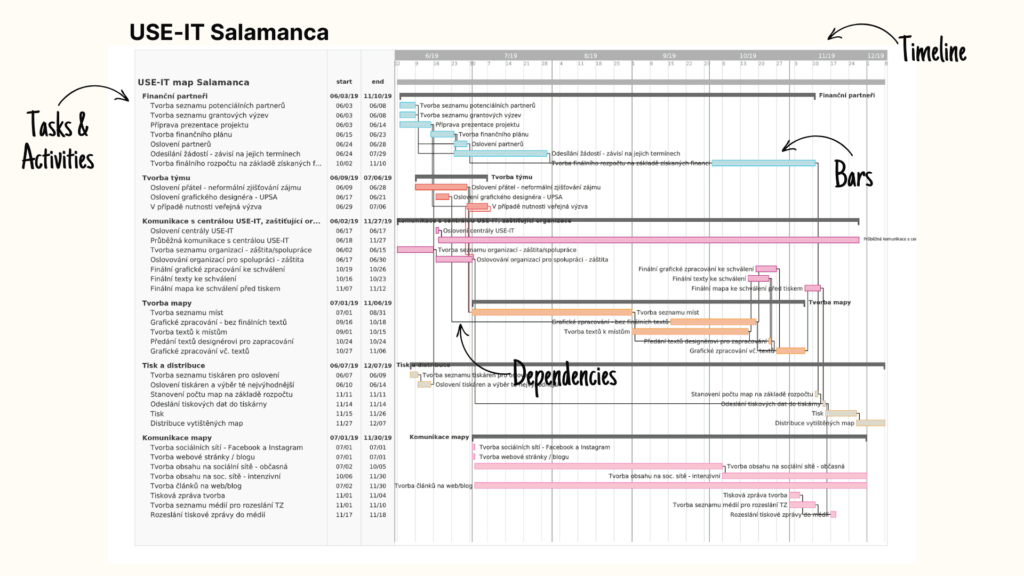
Gantt Chart created for USE-IT Salamanca project with a help of TeamGantt tool.
Straight to the tools
You know what you need?
No time to waste…
Access directly our toolkit right here!

Follow us


